One of the ways to detect problems with your cardiovascular system is by measuring your heart rate. That's why smartphone manufacturers like Samsung have included a pulse oximeter on their flagship phones. The problem is, most people can't afford these kinds of smartphones.
Apps that claim to be able to measure heart rate with a camera do exist. However, researchers from the University of Michigan concluded that these camera-based apps (CBAs) are inferior in accuracy to probe-based apps (PBAs).
I tried a camera-based heart rate measurement app called Heart Rate Monitor to see what it does. The app only displays a fake heart rate and sinusoidal wave when the camera detects the color red, the color of the finger when illuminated. It's very clear that the programmer's motive is only to get profit through advertisements.
Pulse85 is a tiny and lightweight (~4 grams) USB device that I created as a better alternative to camera-based apps. Pulse85 can measure actual heart rate through a technique called photoplethysmography or PPG. Unlike EKG that uses electrodes, PPG uses light to measure heart rate.
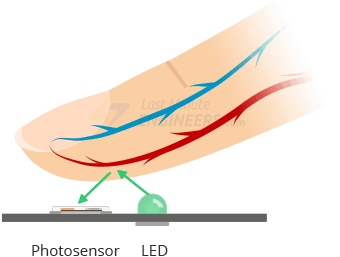
This technique works by illuminating the finger with a green light (~550 nm wavelength) and measuring how much light is reflected (or absorbed) by the oxyhemoglobin in the blood. The measurement is done with a photosensor, a type of sensor that can detect electromagnetic waves, both visible or not.
The accuracy of this technique is far better than a camera, but what's the catch? People with dark skin tones might get false readings, as melanin (dark pigment) also absorbs green light. Another drawback is inaccurate sensor readings that might occur due to external lights.
I think those drawbacks aren't a big deal, as PPG sensors are the only heart rate sensor that is widely available and quite affordable. With that in mind, I then acquired a PulseSensor and a Digispark microcontroller.
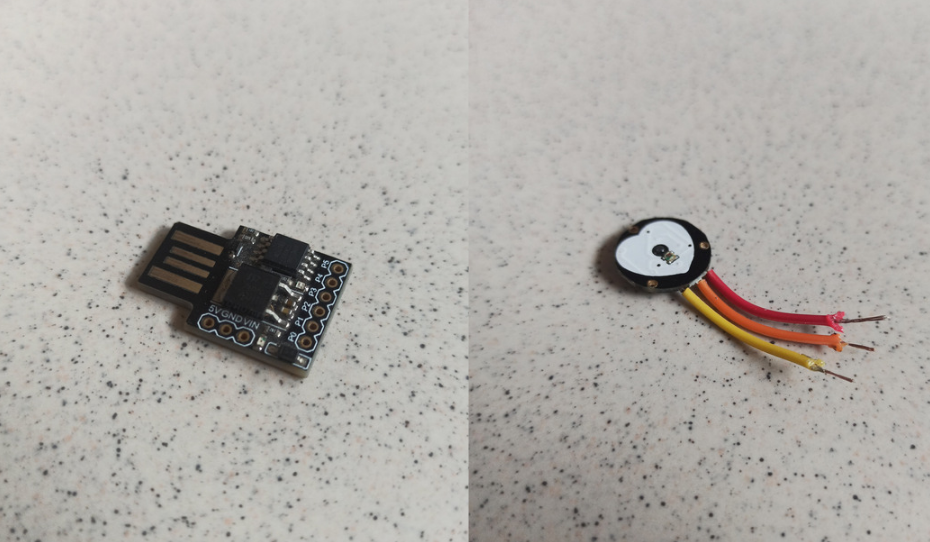
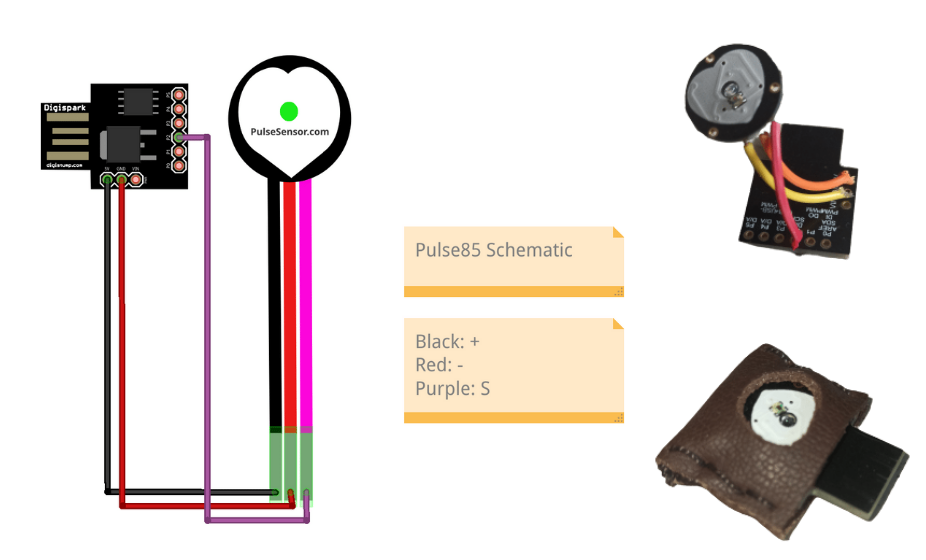
The Digispark itself is a small form factor microcontroller based on the ATtiny85 chip created by Digistump. The sensor was soldered to the microcontroller according to the schematic. I then flashed the code into the Digispark using Arduino IDE.
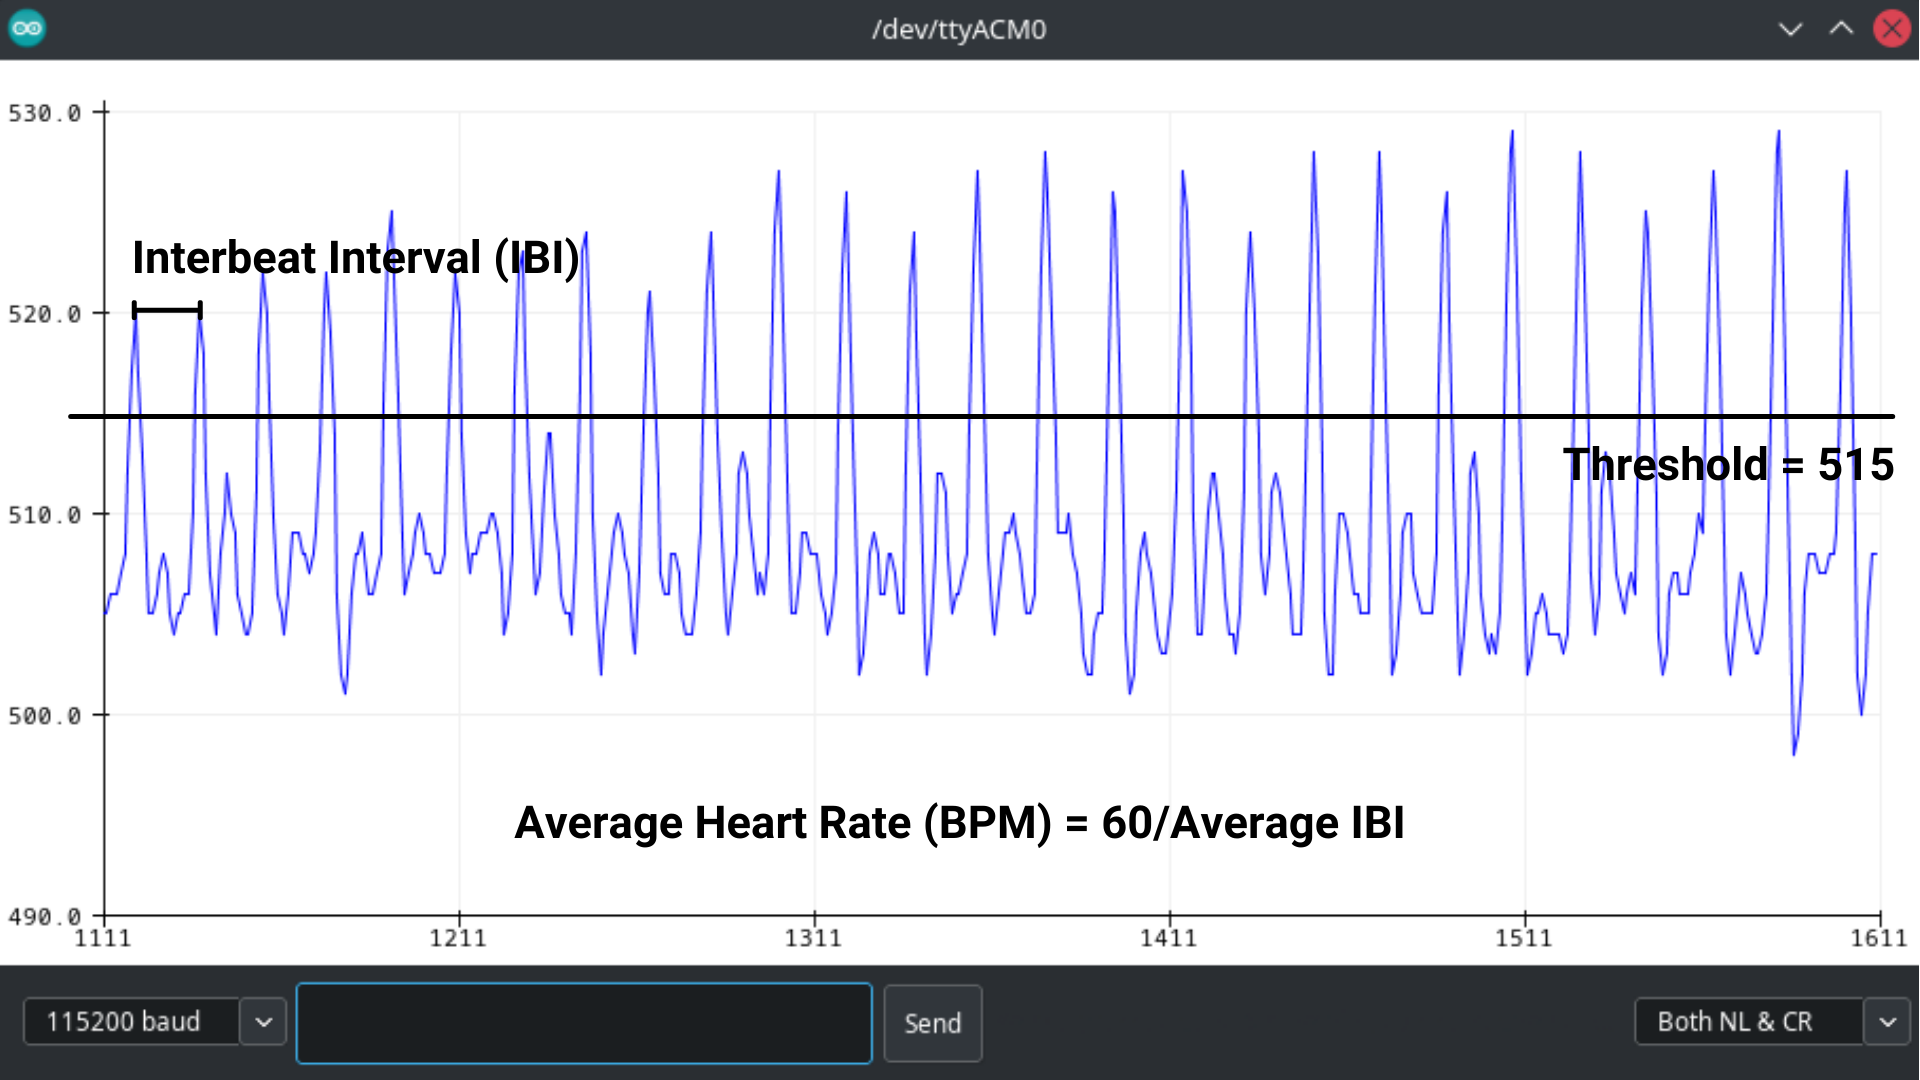
After I finished with the hardware, I opened a serial plotter to test the Pulse85. It works as expected, but the sensor readings are useless without an app, so I created one with Flutter.
Flutter utilizes the Dart programming language, which I haven't learned yet. This project is a chance for me to learn Dart. Turns out, it wasn't as difficult as I presumed.
The most important part of the code is the getBPM function embedded above. I know that you think that codes are dull, so let me explain this code as simple as possible. The input of this function is a list of tuples containing UNIX timestamps and sensor readings. It finds the average of the interbeat intervals (IBI), then converts it into BPM, which is derived by dividing 60 seconds by the average IBI in seconds.
I believe that Pulse85 should be available to all people. That's why I released the source code under the MIT license through GitHub. This encourages other programmers to contribute to the project or utilize the code freely (both libre and gratis).
The application of Pulse85 is not only for the general public but also for researchers. In this section, I analyzed my own heart rate using NumPy, SciPy, and HeartPy.
Firstly, I imported my heart rate data (200 data points) to Google Colab. I then plotted the data with matplotlib, and this is the result:
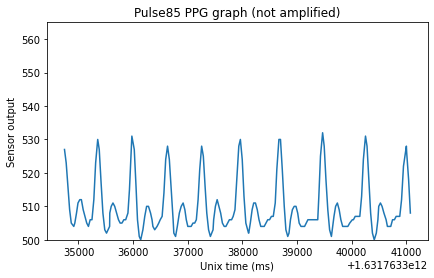
I noticed that the graph looks like it's made from two or three sinusoidal waves, so I ran a fast Fourier transform (FFT) to find the frequency domain. This process was done using the SciPy FFT module. Unfortunately, the FFT analysis failed as it shows the peak as 0 Hz.
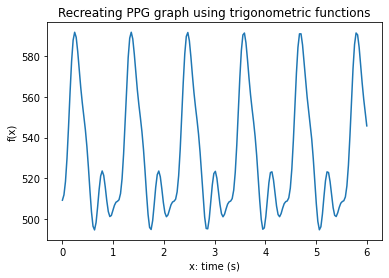
However, I was able to recreate a similar graph using trigonometric functions. It consists of three sine waves with different phases and amplitudes. I also added a 530 vertical shift to make it look more like the actual graph.

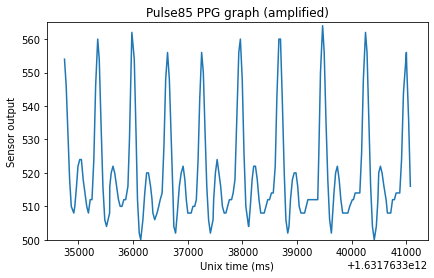
Back to the actual data, I tried the HeartPy module to analyze it. At first, it complained that the library couldn't recognize the heartbeats. So, I amplified the data by a factor of 2 after subtracting the vertical shift of 500 and adding it back.
HeartPy has more features than the Pulse85 app. The library can predict breathing rate and heart rate variability (HRV) using either Welch, periodogram, or FFT algorithm. A higher rMMSD (root mean square of successive RR interval differences) indicates a healthy heart.
| Variable | Value | Average |
|---|---|---|
| bpm | 86.18 bpm | 60-100 bpm |
| breathing rate | 0.411 Hz | 0.2-0.3 Hz |
| IBI | 696.2 ms | 600-1000 ms |
| rMSSD | 46.58 ms | 39 ms |
Even though I was breathing normally during the measurement, HeartPy predicts that my breathing rate is higher than the average. This might be caused by the data amplification since the result differs when I try another factor.
Pulse85 is a portable device powered by PulseSensor and Digispark ATtiny85. It uses PPG to measure the heart rate and sends the data to a phone or a computer. Pulse85 works well as an alternative to camera-based apps, but not EKG. Users should not use the device to self-diagnose cardiovascular and pulmonary diseases, as sensor inaccuracy might lead to misdiagnosis.
Further development to add more functionalities (breathing rate and HRV) is required. However, the device works well when paired with the HeartPy library for heart rate analysis.